
Most people treat life expectancy like a fixed date on a calendar, but that’s an arithmetic lie. Death isn't a destination it’s a probability distribution.
The standard actuarial number you see, 77 for men, 83 for women, is a mean average skewed by early accidents and rare diseases. If you’re in your 30s or 40s and living a low-risk life, that "finish line" doesn't apply to you. To understand your true potential, you have to stop thinking about death as a deterministic event and start thinking about it as a risk you can manipulate.
This isn't about "wellness" or chasing the latest supplement trend. It’s about the brutal reality that your risk of dying doubles every eight years. The real game is identifying the high-impact levers that allow you to physically shove your expiration date nearly two decades into the future.
Black swans happen, but longevity is about taking control of the variables we can and moving ones personal probability function as far to the right as possible.
The "Gaussian" Visual (A Useful Fiction)
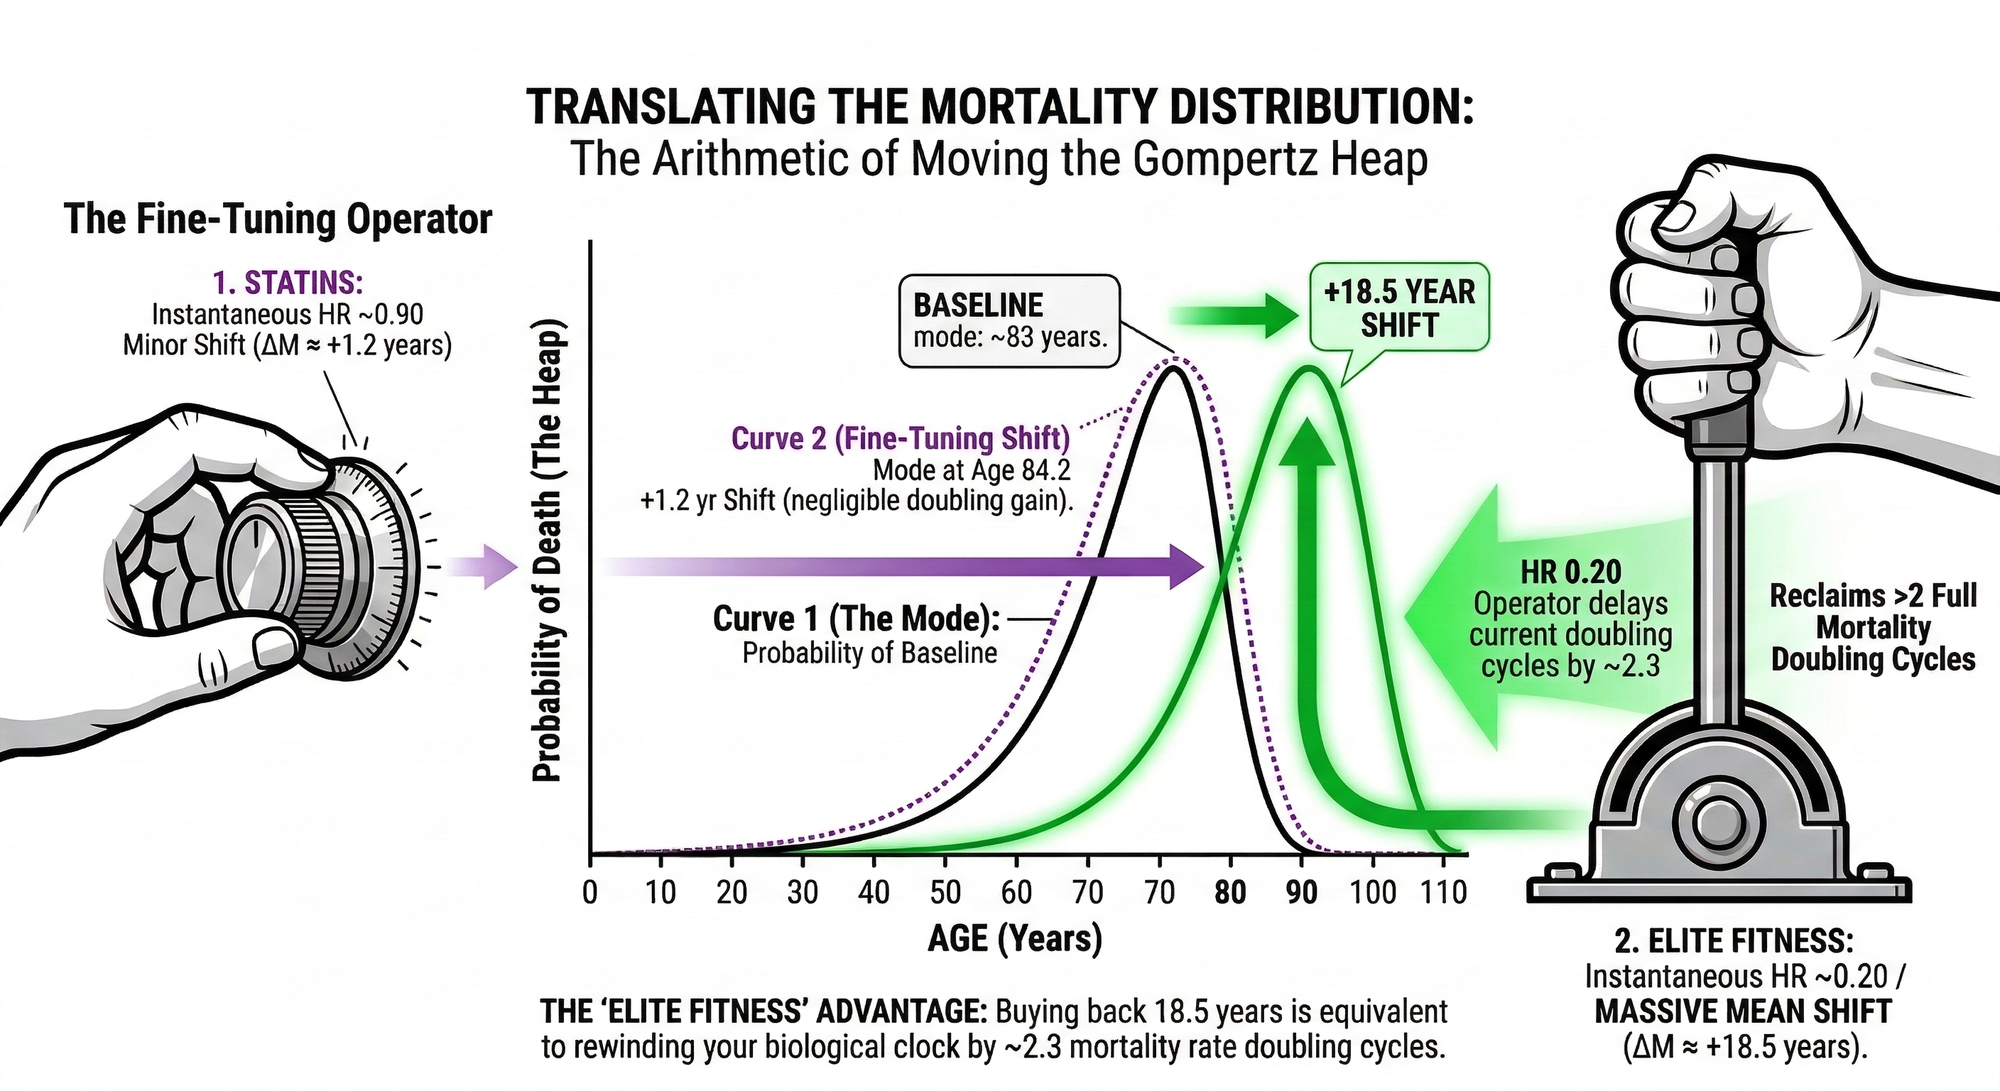
In statistics, the easiest way to visualize a shift is using a Gaussian (Normal) Distribution also known as the classic bell curve. The height of the graph corresponds to an increased probability of death.
When we commit to longevity interventions, we aren't just crossing our fingers and hoping for a lucky break. We are acting as translation operators. We are taking the tall part or "death heap" and physically shoving it to the right such that it happens later in life.
In clinical research, we quantify this shift using Hazard Ratios (HR). It is critical to understand that an HR is not a direct measure of life expectancy; it is a measure of the force of mortality, or your instantaneous risk of death at any given moment.
If an intervention has an HR of 0.50, it means you have cut your instantaneous risk of death in half compared to a baseline group. In the mathematical framework of longevity, cutting that risk in half is the exact equivalent of buying back one full mortality doubling cycle, which for humans is roughly 8 years.
| Hazard Ratio (HR) | Instantaneous Risk Reduction | Rightward Mean Shift (ΔM) |
|---|---|---|
| 0.90 | 10% reduction | ~1.2 years |
| 0.75 | 25% reduction | ~3.3 years |
| 0.50 | 50% reduction | ~8.0 years (One Doubling Cycle) |
| 0.25 | 75% reduction | ~16.0 years (Two Doubling Cycles) |
| 0.20 | 80% reduction | ~18.5 years |
The Statstical Reality
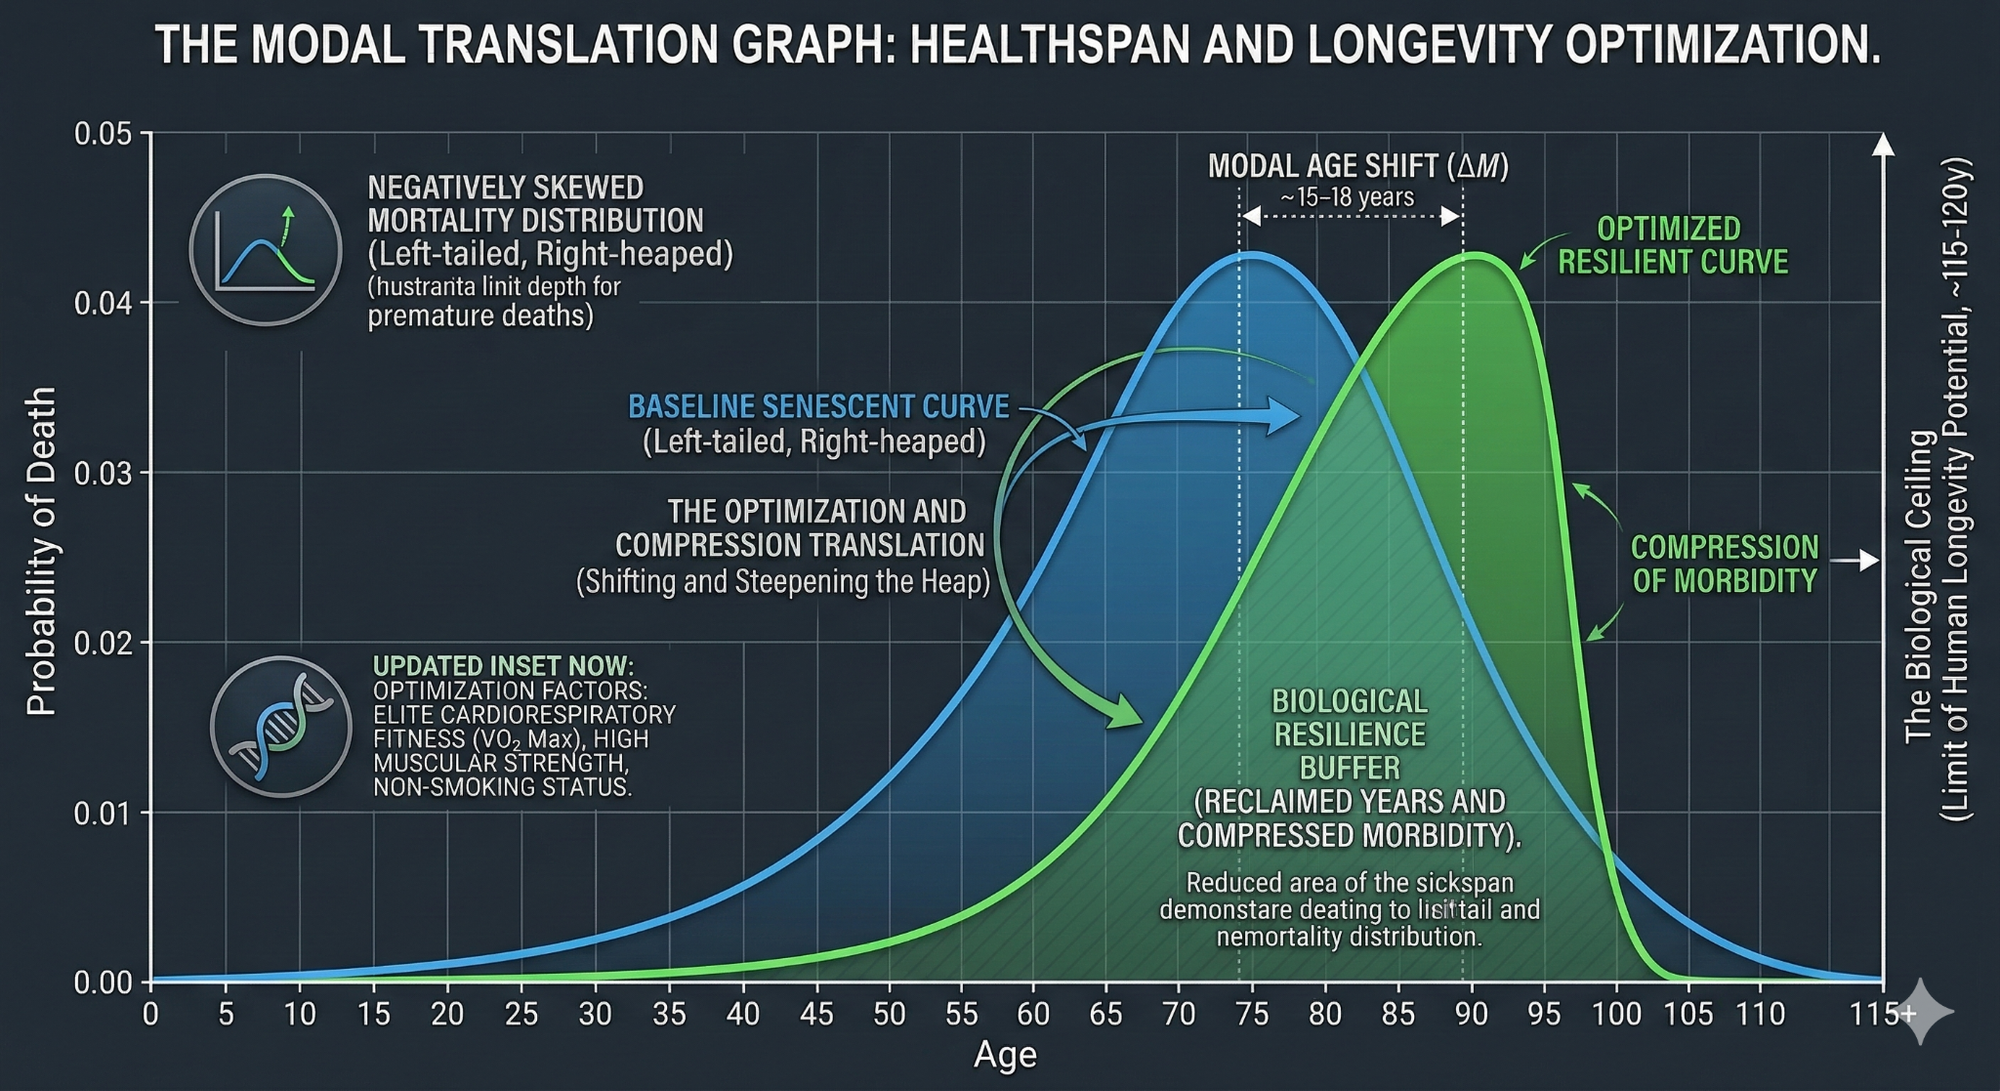
Now, let’s get a bit more precise. Human mortality is not a symmetrical bell curve. It is a negatively skewed distribution. It has a long, thin tail on the left (people dying young) and a massive "heap" or mode on the right, usually situated between ages 80 and 90.
The most accurate model for describing the human "death heap" is the Gompertz-Makeham Law. This law defines the force of mortality as an exponential function of age.
The Gompertz Law: Force of Mortality = A + B * e^(C * x)
- A (The Makeham Term): Your background mortality. This is age-independent risk from external causes like accidents or acute infections.
- B * e^(C * x) (The Gompertz Component): Your intrinsic, senescent mortality. This represents the biological degradation that increases exponentially as you age.
- C (The Rate of Aging): This parameter determines how quickly your risk of death doubles.
In the modern era, we have largely mitigated the background risk (A) through sanitation and safety. True longevity potential now rely on manipulating the B and C parameters to delay the onset of biological senescence.
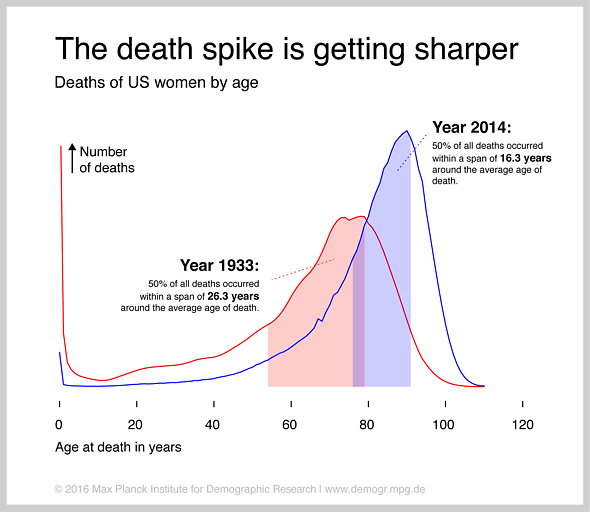
Your risk of dying doubles roughly every 8 years. Because that risk accelerates so fast, the "tail" on the right side of the peak is very short and does not slowly taper off. You hit a biological wall.
The good news is that the miracle of modern medicine has already shifted this curve as can be seen in the above chart comapring the death probilility curve of 1933 and 2014.
I don't know about you but this still is not enough for me as I have a long bucket list of mountains to climb and places to explore so let’s dive into how we can shift this even farther to the right.
Key Lifespan Levers: How Much Can We Shift?
If you want to move the heap, you need to know which levers have the most impact. Not all longevity interventions are created equal and some are absolute monsters.
1. VO2 Max: The Heavyweight Champion
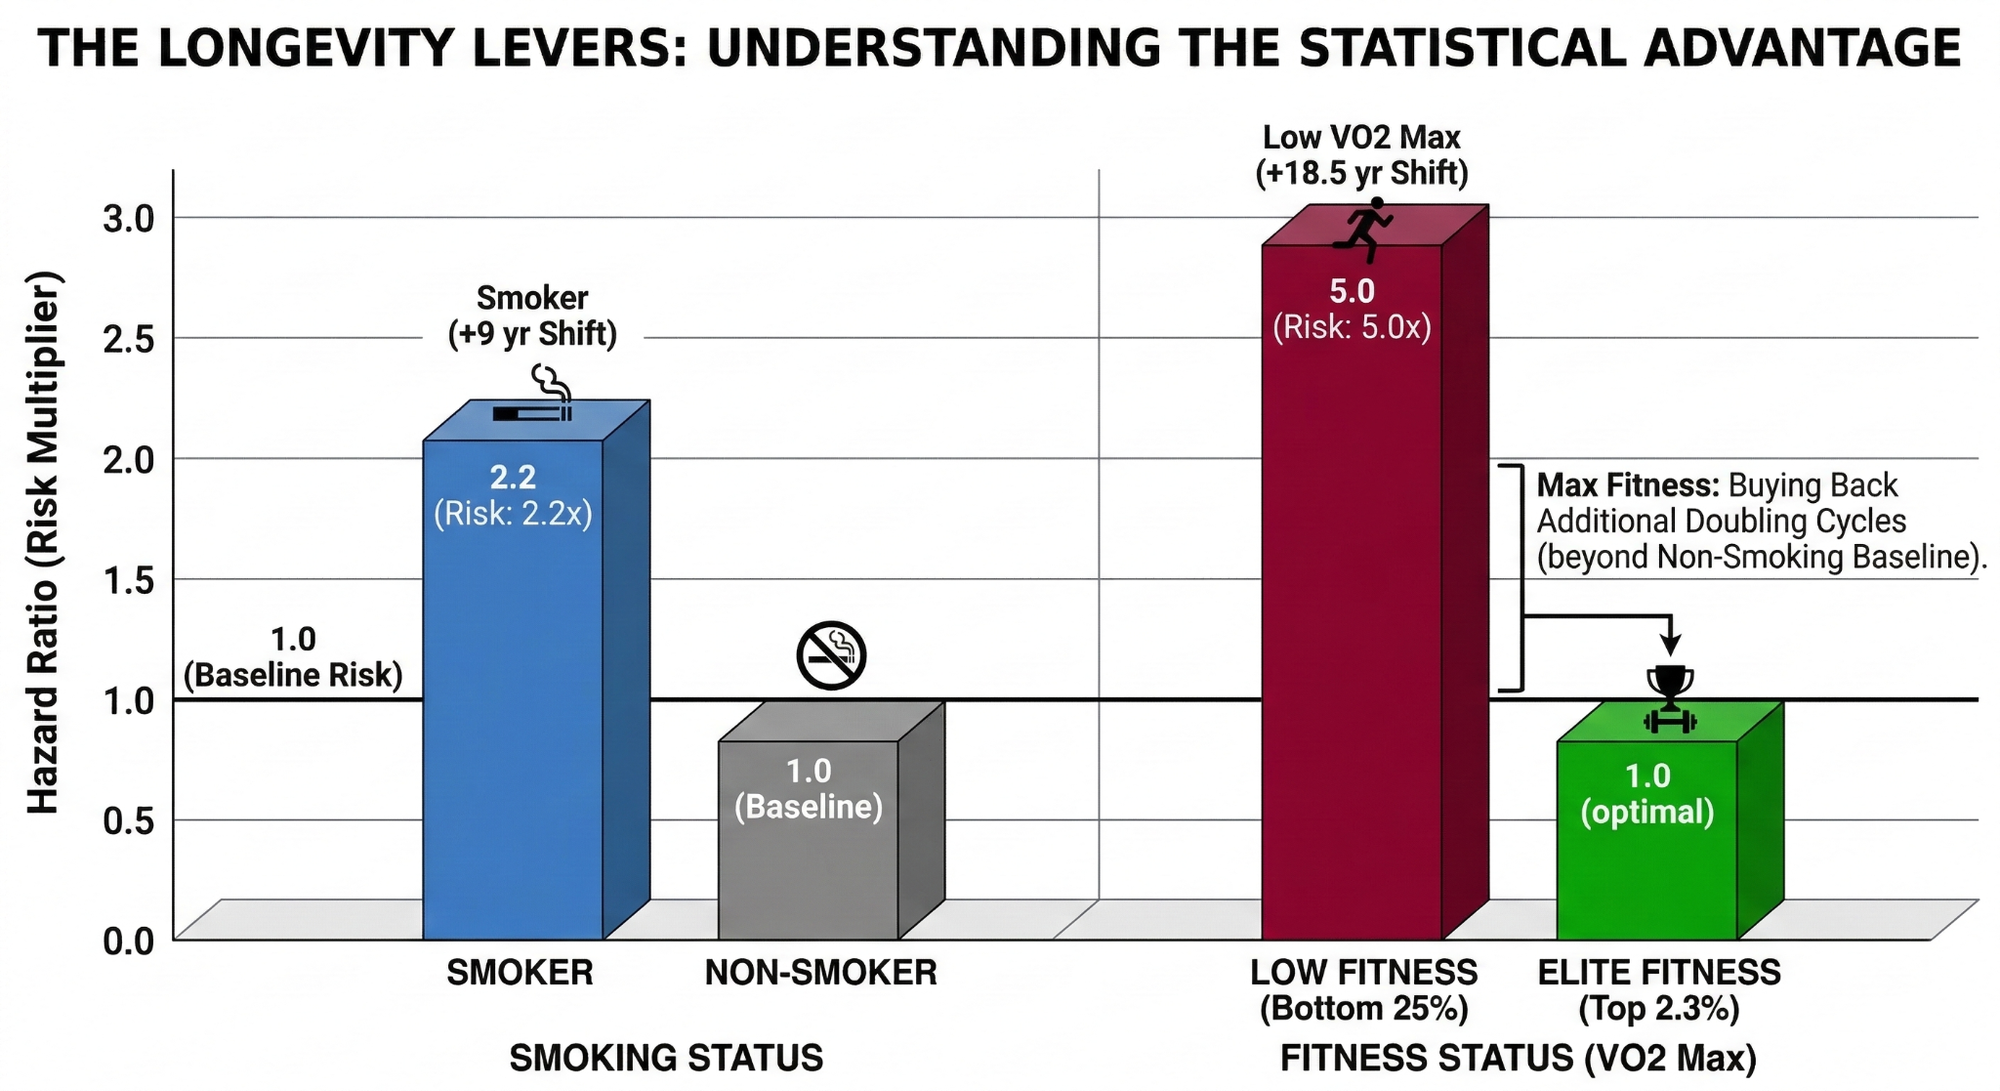
Cardiorespiratory Fitness (VO2 max) is the single most potent modifiable predictor of death. Moving from "Low" fitness to "Elite" fitness carries a Hazard Ratio of roughly 0.20.
- The Shift: ~18.5 Years.
- The Nugget: Every single 1 mL/kg/min increase in your VO2 max is associated with an approximately 45-day increase in life expectancy.
Don't confuse the speedometer with the engine. VO2 Max is the measurement but cardiovascular fitness itself is where these longevity gains stem from. We are not training VO2 max to win an imaginary high score game but it just happens to be the most accurate measure we have of overall cardiovascular capacity.
The longevity benefit comes form the work and training. The result is the metric.
If curious where your personal VO2 max sits check out the table below. If you do not know your VO2 max you can get an official test in a lab or estimate it via using a smartwatch with VO2 max prediction (like Garmin) or by doing a Cooper 12 Minute run test.
| Age Range | Low | Below Average | Above Average | High | Elite |
|---|---|---|---|---|---|
| Women | |||||
| 18-19 | 34 | 35 | 40 | 46 | 53 |
| 20-29 | 27 | 28 | 36 | 41 | 51 |
| 30-39 | 26 | 27 | 34 | 39 | 49 |
| 40-49 | 25 | 26 | 32 | 37 | 47 |
| 50-59 | 24 | 25 | 29 | 36 | 46 |
| 60-69 | 20 | 21 | 25 | 30 | 40 |
| 70-79 | 17 | 18 | 22 | 25 | 36 |
| 80+ | 14 | 15 | 20 | 23 | 30 |
| Men | |||||
| 18-19 | 37 | 38 | 46 | 50 | 58 |
| 20-29 | 35 | 36 | 43 | 49 | 56 |
| 30-39 | 34 | 35 | 40 | 46 | 53 |
| 40-49 | 33 | 34 | 39 | 44 | 52 |
| 50-59 | 28 | 29 | 36 | 41 | 50 |
| 60-69 | 24 | 25 | 30 | 36 | 46 |
| 70-79 | 20 | 21 | 25 | 30 | 41 |
| 80+ | 17 | 18 | 23 | 26 | 36 |
2. Strength: The Foundation of Robustness
It’s not just about your heart but also your muscular system health. Low muscle mass and low grip strength are massive risk factors. High muscle strength compared to low strength carries an HR of roughly 0.65 to 0.70.
- The Shift: ~4 to 5 Years.
- Why it matters: Strength is what prevents the "fall" that leads to the hospital that leads to the end—it's what "steepens" the curve.
Much like VO2 max, grip strength and other specific strength numbers are just proxies for a robust muscular system. That system is the actual goal and the thing that truly matters for your longevity. High strength provides the physical armor that shifts your personal mortality heap by four to five years. I see people obsessively training their grip because they saw a correlation study. That represents a fundamental misunderstanding of the biological mechanisms at play. They are focusing on the indicator while ignoring the actual engine.
3. Omega-3 Index: The Fire Extinguisher
The Omega-3 Index measures the amount of EPA and DHA in your red blood cells. Research has found that having a high Omega-3 index (above 8%) vs. a low one (below 4%) is as predictive of longevity as not smoking. It has an HR of about 0.85.
- The Shift: ~1.5 to 2 Years.
- Why it matters: This is low-hanging fruit. A simple supplement and some sardines can give you some actual statistical margin.
4. Not Smoking: The Baseline
Smoking is essentially a "Reverse Mean Shift". It pushes your heap about 10 years to the left.
- The Shift: ~9 Years (Reclaimed).
Shifting vs. Rectangularizing: The Strategy of Longevity
There are two distinct statistical games we are playing here. To win, you have to understand the difference between moving the date on a calendar and changing the way you feel while you're still on it.
1. Translation (The Shift)
This is a pure statistical "Mean Shift." By reducing your force of mortality through high level interventions, you are physically pushing your entire probability distribution or the "death heap" to the right. You are delaying the inevitable. The risk here is that if you only shift the curve, your "sickspan," or that period of late life decline, might simply move with it. You live longer, but you might still spend the last decade of your life in a state of diminishing autonomy.
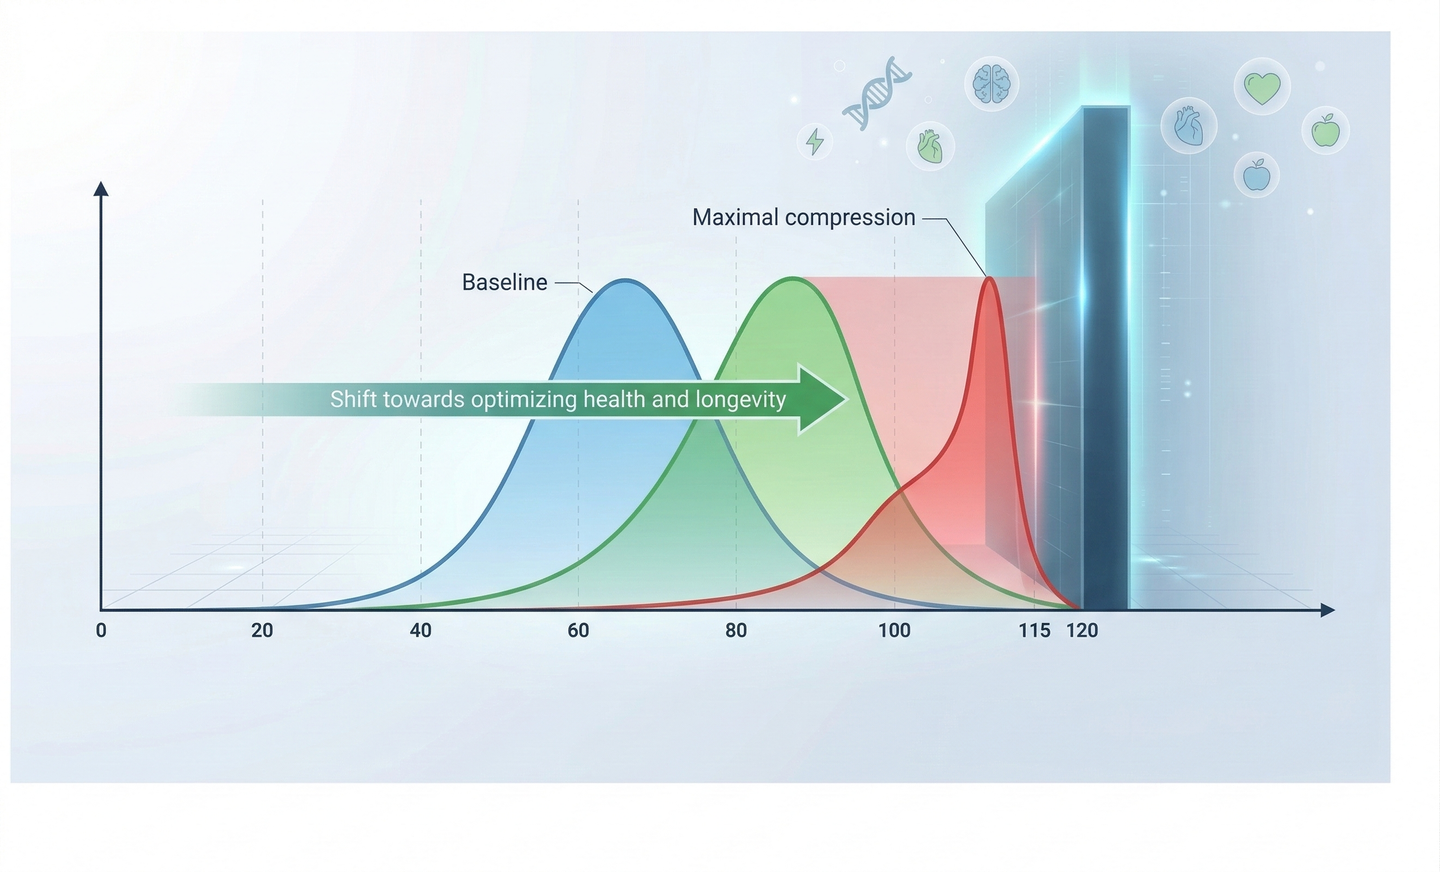
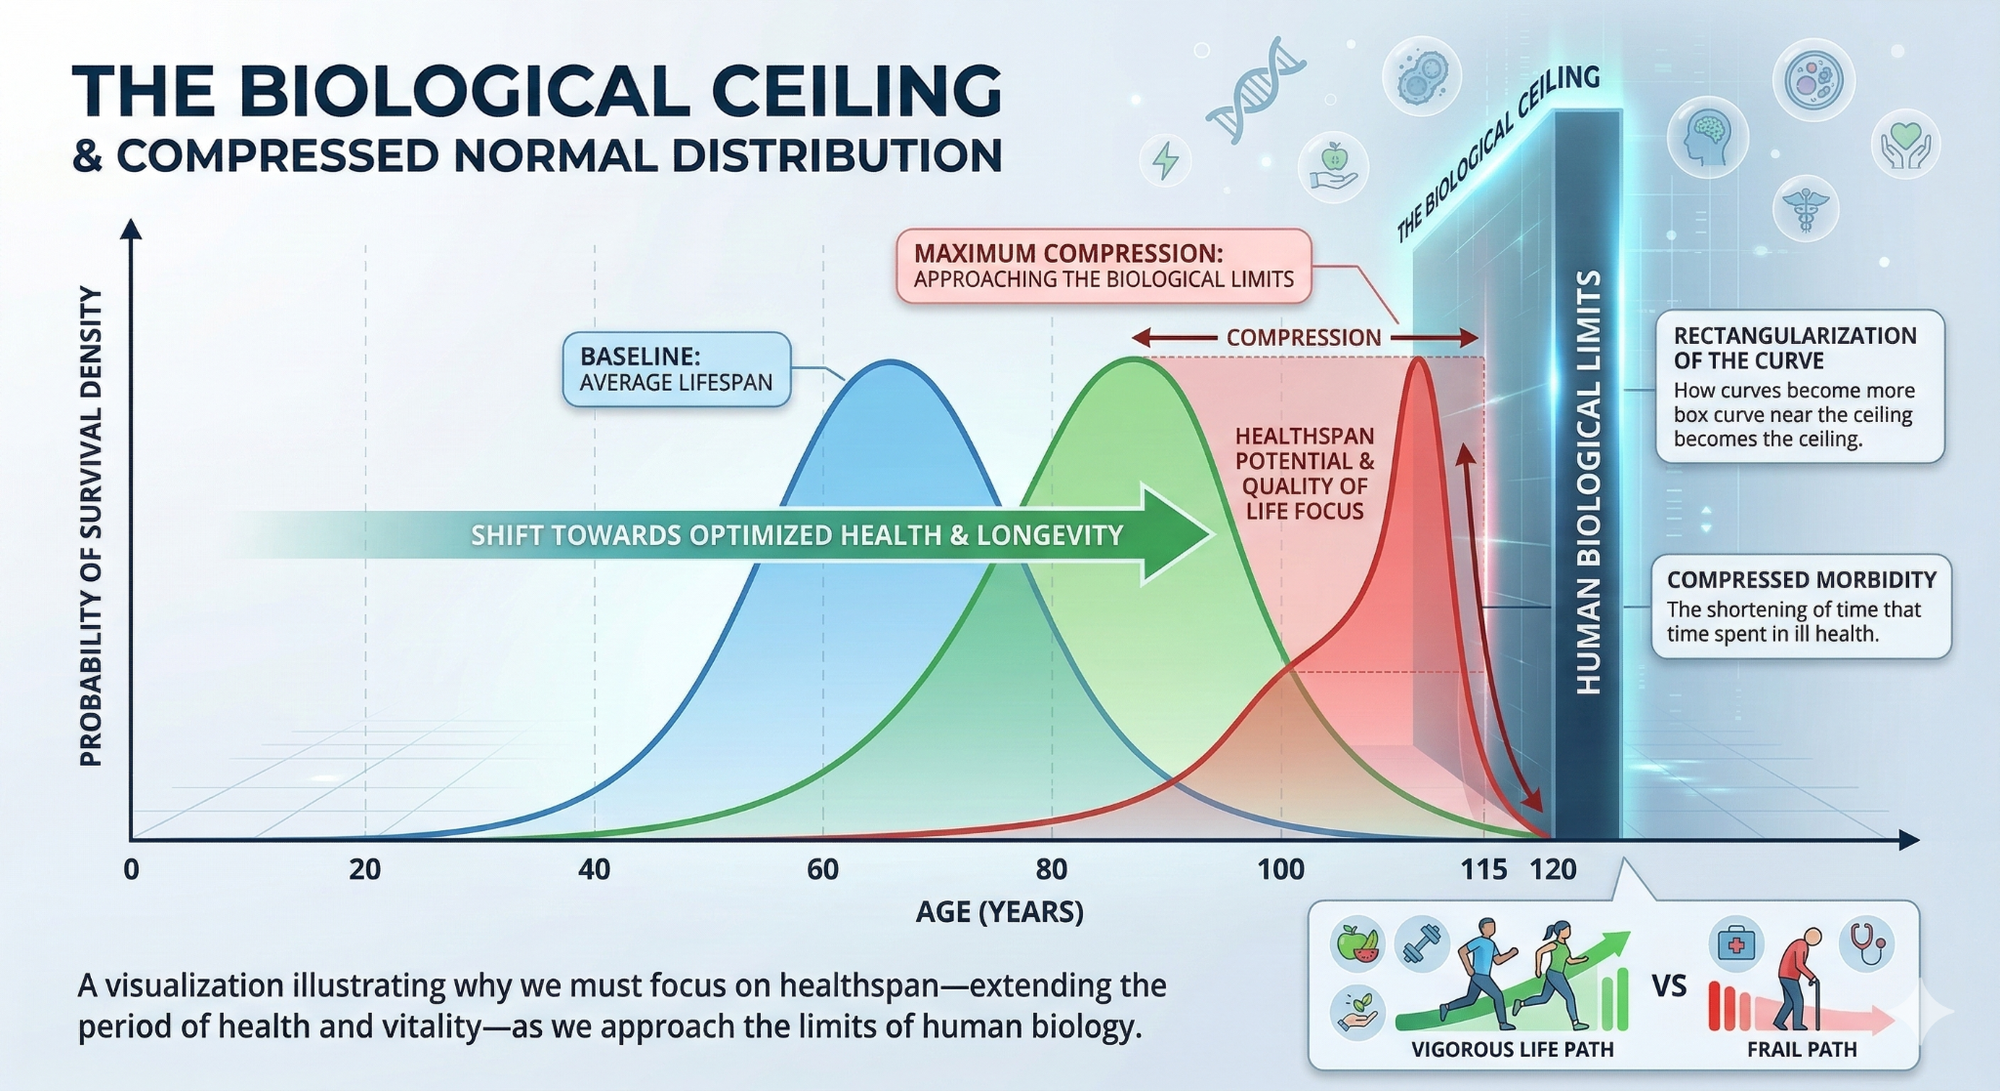
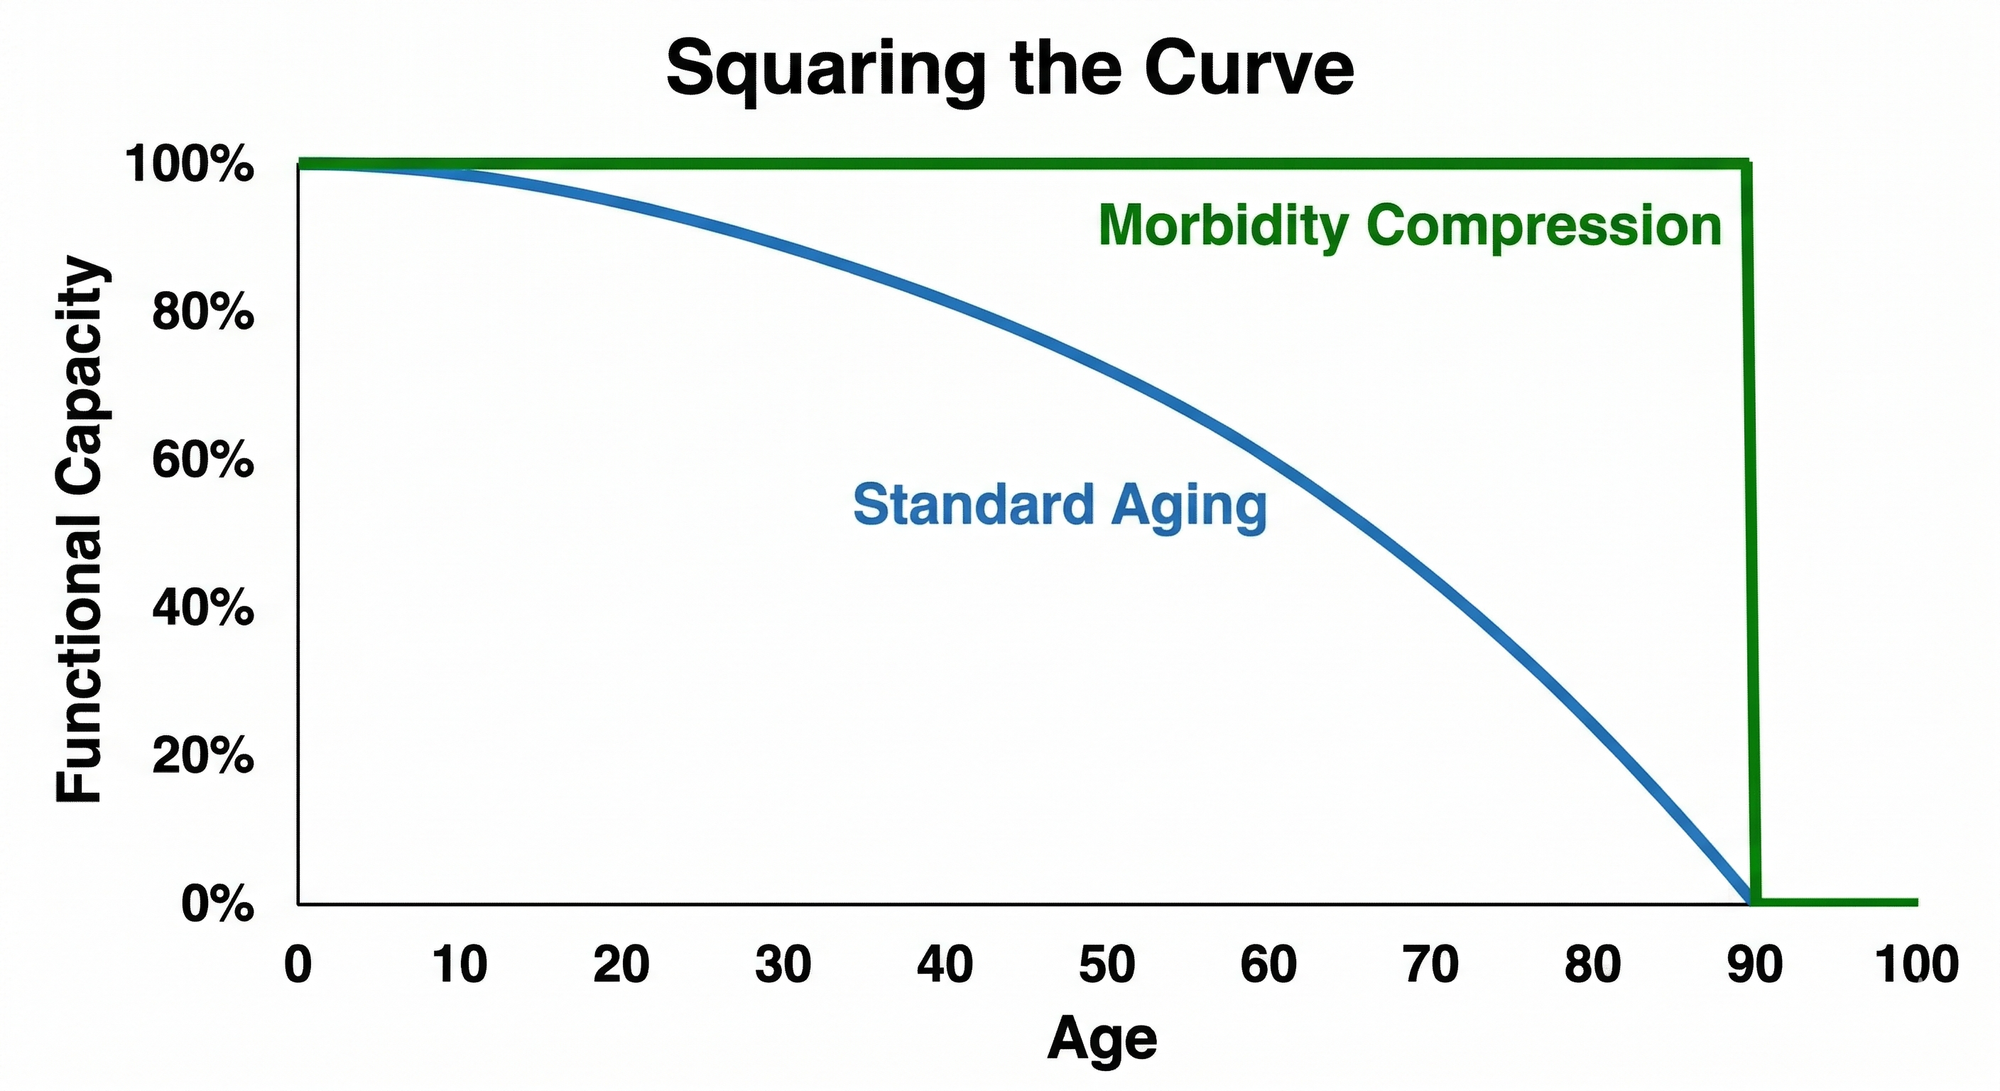
2. Rectangularization (The Compression)
This is what we call "Squaring the Curve." Instead of just moving the peak, we are trying to change the shape of the function. We want to maintain high functional capacity and robustness as long as possible, followed by a very sharp, sudden drop at the very end. In the engineering world, this is Morbidity Compression. We want to stay at 100 percent for as long as we can, then hit the wall fast.
The Unified Theory: Healthspan as the Real Prize
The good news is that the most powerful levers we have don't make us choose between the two. Interventions like high VO2 Max, elite muscular strength, and non smoking status are dual purpose operators.
Take strength, for example. High muscle mass and grip strength are proxies for a robust system. That robustness acts as physical armor. It doesn't just shift your death curve by four or five years; it allows you to maintain the autonomy to hike, ski, and live without assistance well into your 80s and 90s.
Not all years are created equal. While the statistical shift is a great byproduct, the real goal should be maximizing experiences and happy moments. I like to focus on the healthspan interventions because they provides the quality of life that make the extra quantity worth having.
The Ultimate Longevity "Nugget"
We are not just victims of a deterministic clock. Every bit of fitness you gain and every metabolic marker you optimize acts as a translation operator. Every ounce of extra muscle mass and cardiovascular capacity you build is a physical buffer against your instantaneous risk of death.
The strategy is to shift your personal death heap as far to the right as possible, while maintaining the physical and mental robustness to actually enjoy those years before you hit the biological ceiling.
Manipulating this probability function is the name of the game. Don't kid yourself as of today the biological limits are real, and we can't control every black swan event - but why not play the hand we are dealt as best we can. We control what we can, pull the heavy levers, and give ourselves the ultimate statistical advantage for a long, high-functioning life.
Thanks for reading and please consider following along for more articles and experiments.
Sources:
- Mandsager, K., et al. (2018). Association of Cardiorespiratory Fitness With Long-term Mortality Among Adults Undergoing Exercise Treadmill Testing. JAMA Network Open.
- Ruiz, J. R., et al. (2008). Muscular strength as a predictor of all-cause mortality in an apparently healthy population. BMJ.
- Bohannon, R. W. (2019). Grip Strength: An Indispensable Biomarker For Older Adults. Clinical Interventions in Aging.
- Harris, W. S., et al. (2021). Blood n-3 fatty acid levels and total and cause-specific mortality from 17 prospective studies. Nature Communications.
- Jha, P., et al. (2013). 21st-Century Hazards of Smoking and Benefits of Cessation in the United States. The New England Journal of Medicine.
- Fries, J. F. (1980). Aging, Natural Death, and the Compression of Morbidity. The New England Journal of Medicine.