

Two years ago, I was doing some regular bloodwork, genuinely assuming I was the image of perfect health. Yet, when I got my results back, my Hemoglobin A1c (HbA1c) was on the border of the prediabetic range at 5.6%.
I was initially in shock. I thought I ate pretty healthy a majority of the time and also had made exercise a priority for many years. My reaction was to dive straight down the research rabbit hole and understand the fundamentals of what may be going on. I found that my Fasting Glucose (81 mg/dL) and insulin(3.2 uIU/mL), my HOMA-IR (0.67), and even an at-home Oral Glucose Tolerance Test (OGTT) using a Continuous Glucose Monitor pointed to pristine metabolic health. This HbA1c level was clearly misleading me. See my article on this at home OGTT.
In my research I found similar anecdotal stories everywhere. World-class athletes are routinely shocked to find their long-term glucose marker suggests they are on a path toward Type 2 Diabetes. This is the HbA1c Paradox, and understanding it requires looking past static lab thresholds and diving into the unique, high-performing physiology of the trained body.
The Data: Training Intensity Elevates HbA1c
The paradox is not just anecdotal but also clearly demonstrated in research. A seminal 2008 study compared professional cyclists, elite cyclists, and sedentary controls showing a positive correlation between training volume and higher HbA1c and the opposite for fasting glucose [1].
- Fasting Glucose (mg/dL) was inversely correlated with training intensity (r = -0.320): The hardest-training athletes had the highest long-term average glucose reading, a statistically significant difference (p=0.017) compared to controls [1].
- HbA1c was directly correlated with training intensity (r = 0.190): The hardest-training athletes had the highest long-term average glucose reading, a statistically significant difference compared to controls.
For the sedentary person, a high HbA1c and high Fasting Glucose usually go hand-in-hand, signaling T2D risk. For the athlete, the HbA1c is elevated, but the Fasting Glucose is often pristine. This suggests the high HbA1c may be a byproduct of adaptation, not dysfunction.
The Three Physiological Drivers of the Paradox
HbA1c measures the glucose that bonds to the hemoglobin protein in red blood cells over their lifespan (~120 days) [2]. This bonding process, called glycation, is irreversible. The reason athletes deviate from the norm lies in what influences that 120-day cycle and the glucose levels during it.
1. Longer Red Blood Cell Lifespan
The standard 120-day assumption for RBC turnover is the flaw in athletic testing.
- The Theory: Chronic endurance training subtly extends the lifespan of red blood cells, potentially by 10 to 20 days [3].
- The Mechanism: A high-performing, well-trained body is characterized by lower systemic inflammation and oxidative stress, both of which typically damage and shorten RBC life [3].
- The Result: A longer-lived RBC is exposed to glucose for a longer period of time. Even if the glucose concentration is perfectly healthy, the extended duration of exposure increases the total accumulated glycation, artificially inflating the HbA1c result.
2. Hormonal Stress and Adaptive Hyperglycemia
Intense exercise is a massive physical and physiological stressor, triggering a necessary hormonal cascade to mobilize fuel.
- The Mechanism: The activation of the hypothalamic-pituitary-adrenal (HPA) axis releases cortisol and catecholamines (adrenaline/noradrenaline). These hormones stimulate the liver to rapidly produce and release glucose (gluconeogenesis), ensuring working muscles have immediate fuel access [4].
- The Impact: These repeated, necessary glucose surges during and immediately after training elevate blood sugar transiently (e.g., professional soccer players have been observed exceeding 180 mg/dL during matches). While these spikes are short-lived and adaptive, when averaged over three months, they contribute to the higher HbA1c reading.
- My observations: During my CGM experiment which I wrote about HERE showed large spikes in my glucose levels during exercise when my body needed to mobilize fuel. I found that my normal fasting glucose of ~90 would shoot upwards to ~120 when training fasted and with longer duration training sessions this elevated period would start to have an impact on my average glucose levels. One other learning from this was if I fueled my workouts with some simple carbs I had less of a glucose spike and hypothesized that the carbs signaled to my body to blunt the rapid counter-regulatory hormone response (cortisol/glucagon), thereby reducing the need for the liver to initiate aggressive gluconeogenesis (dumping liver glycogen stores), resulting in a smaller spike and less overall glycation.
3. Transient Post-Exercise Insulin Resistance
Following prolonged, strenuous exercise, the body’s metabolism shifts gears in a way that can look alarming on paper.
- The Mechanism: Post-exercise, the body enters a state of transient insulin resistance, which can last for several hours to a full day [6]. This is a deliberate, protective adaptation designed to accelerate the replenishment of muscle glycogen stores by conserving glucose for muscle repair and prioritizing fuel for the brain [5].
- The Clinical Look: If you were to perform an Oral Glucose Tolerance Test (OGTT) the day after a long run, your results might show impaired glucose tolerance. This temporary insulin resistance contributes to the overall 3-month average, but it is quickly reversed with rest and proper fueling.
Beyond the Number: The Essential Diagnostic Workup
Given the complexity, relying on HbA1c alone to assess diabetes risk in an athlete is an incomplete and misleading clinical practice. The goal is to differentiate an adaptive physiology from a genuine failure in glucose regulation. If your HbA1c is elevated, a nuanced approach demands complementary testing:
1. Fasting Glucose and Fasting Insulin
The first, simplest step is to look at the baseline function of your insulin system [7]:
- Fasting Glucose: A metabolically healthy athlete will typically have an FPG in the 80–95 mg/dL optimal range. If your FPG is consistently elevated (>= 100 mg/dL or >= 5.6 mmol/L), this suggests you may have genuine hepatic insulin resistance.
- Fasting Insulin: If you have true insulin resistance, your pancreas compensates by pumping out excess insulin (hyperinsulinemia). A healthy athlete's fasting insulin should be low (<= 10 µU/mL or ideally <= 5 µU/mL), demonstrating high insulin sensitivity.
- HOMA-IR: Calculating the Homeostatic Model Assessment for Insulin Resistance (HOMA-IR) using these two values provides a quantitative score of sensitivity. A low score (e.g., < 1.5) confirms superior metabolic function.
2. The Gold Standard: Oral Glucose Tolerance Test (OGTT)
The OGTT is the definitive dynamic test for glucose tolerance and is superior to HbA1c in assessing an athlete's real metabolic function at rest [8].
- The Procedure: The test measures how quickly your body clears a 75 g glucose load [8].
- The Healthy Athlete Response: An athlete with the HbA1c Paradox will clear the glucose load rapidly, with their 120-minute measurement often returning to a normal, low baseline, confirming their muscle's superior ability to dispose of glucose.
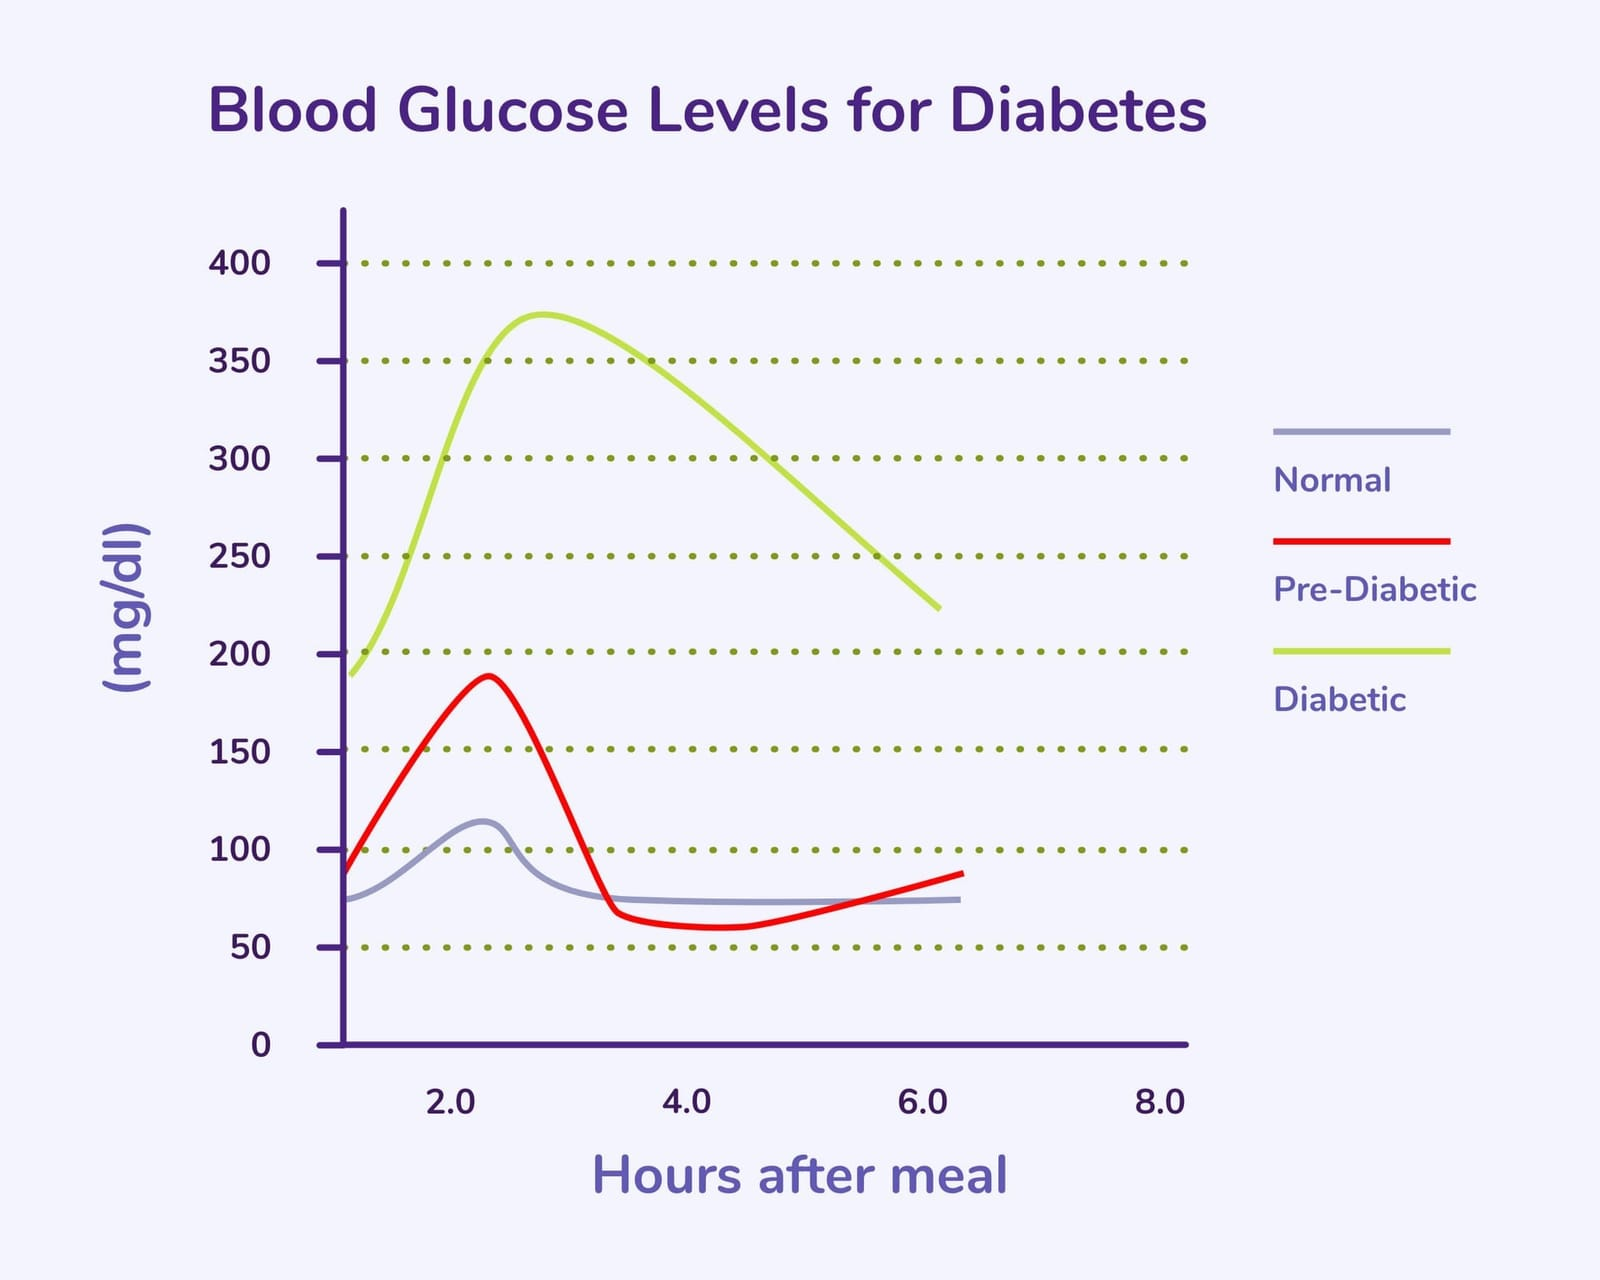
- The Visual: The OGTT curve for a metabolically healthy athlete shows a sharp peak followed by an extremely rapid return to baseline, demonstrating superior glucose disposal compared to the slow, prolonged curve seen in T2D.There are many ways of looking at metabolic health but the shape of one's blood glucose and insulin response to a large load of glucose is the most informative.
3. Using HbA1c for Trends, Not Triage
As a static measurement, HbA1c is flawed in many ways and even for non athletes can have variation over a population with similar metabolic health. However, its value is often best realized not in its absolute number, but in its change over time.
If your HbA1c increases from 5.4% to 5.8% over a year without a change in training, that is a genuine signal of possible metabolic drift or chronic, unmanaged stress (poor sleep, underfueling). If it stays static at 5.7% while your Fasting Glucose remains low, it is likely just your physiological baseline.
4. Assessing Metabolic Health via Lipids and Ratios
The standard lipid panel is often viewed solely through the lens of cholesterol, but it offers critical insights into insulin sensitivity. While LDL-C measures the cargo of lipoproteins, the relationship between your Triglycerides and HDL-C provides a window into the metabolic engine driving them.
- The Triglyceride/HDL Ratio: This simple calculation is one of the most powerful proxies for insulin resistance available on a standard blood test.
- The Mechanism: In a state of insulin resistance, the liver overproduces triglyceride-rich VLDL particles. Simultaneously, the enzymes responsible for clearing lipids and building protective HDL are down-regulated. This creates a specific "atherogenic dyslipidemia" characterized by high triglycerides and low HDL [11].
- The Thresholds:
- Optimal (< 1.5): A ratio below 1.5 (when measured in mg/dL) strongly correlates with high insulin sensitivity and larger, less atherogenic LDL particles. Ideally, you want a 1:1 ratio.
- High Risk (> 3.0): A ratio above 3.0 is a clinically validated marker for insulin resistance, often identifying metabolic dysfunction that HbA1c misses [12].
If your HbA1c is 5.7% but your Triglyceride/HDL ratio is 0.8, the weight of evidence suggests your metabolism is healthy and the HbA1c is likely an artifact of red blood cell longevity.
5. Rule Out Iron Deficiency and Chronic Stress
Before settling on the "adaptive" explanation, ensure you've ruled out correctable, underlying issues that extend RBC life:
- Iron Status: Get a full iron panel (ferritin, TIBC, transferrin saturation). Iron deficiency is a common cause of artificially inflated HbA1c in non-diabetics because it prolongs RBC lifespan [9].
- Stress Management: High, sustained, non-training stress (from sleep deprivation, life stressors etc. ) drives up cortisol, compounding the training effect [10].
- Inadequate fueling (low energy availability) stresses the system, raising cortisol, which can worsen the HbA1c effect. I have worked with a few people dealing with Relative Energy Deficiency in Sport (RED-S) and helped catch this lack of energy availability through looking at metabolic health markers. For these people and many athletes I have seen an improvement in HbA1c and metabolic markers but adding in more simple carb fueling.
Actionable Takeaways for the Athlete
If you are a high-volume athlete and your HbA1c is borderline high you should start by doing a deeper dive into some of the other markers we have discussed to understand how to react as when it comes to understanding metabolic health HbA1c alone is not sufficient.
- Fuel Properly: Do not restrict carbohydrates in response to a high HbA1c. Ensure adequate mid-exercise fueling and high protein intake for recovery.
- Get Contextual Labs: If you only have HbA1c, ask your clinician to check Fasting Glucose, Fasting Insulin, a lipid panel for looking at possible insulin resistance via triglyceride to HDL ratio, and lastly a full Iron Panel. The results of these tests are the final arbiter of your T2D risk.For all these testing needs I highly recommend GoodLabs as after extensive research and trying many companies have found them not only to have the best prices and product but also love they are on the mission to democratize blood tests for everyone by providing free biomarkers for people donating blood.
- Manage Stress: Focus on improving sleep quality and reducing non-training stressors, as these factors compound the hormonal load that contributes to the paradox.
Sources
[1] Goh, S. Y., et al. (2008). Hyperglycaemia in elite athletes: the effect of training on HbA1c and fructosamine. British Journal of Sports Medicine, 42(10), 834-838. [https://bjsm.bmj.com/content/42/10/834]
[2] American Diabetes Association. (2019). 4. Comprehensive Medical Evaluation and Assessment of Comorbidities. Diabetes Care, 42(Suppl 1). [https://diabetesjournals.org/care/article/42/Suppl_1/S37/47101/4-Comprehensive-Medical-Evaluation-and-Assessment]
[3] Browning, K. N., & Jessop, D. S. (2014). Chronic Endurance Training and HbA1c. Diabetes, 63(12), 4060-4062. [https://diabetesjournals.org/diabetes/article/63/12/4060/35650/Chronic-Endurance-Training-and-HbA1c]
[4] Hansen, J. S., et al. (2018). Catecholamines and exercise: focus on adrenaline-induced glucagon and glucose release. European Journal of Endocrinology, 178(4), C19-C27. [https://eje.bioscientifica.com/view/journals/eje/178/4/EJE-17-0808.xml]
[5] Ivy, J. L. (2004). Glycogen resynthesis after exercise: effect of carbohydrate intake. International Journal of Sports Medicine, 25(Suppl 1), S35-S40. [https://pubmed.ncbi.nlm.nih.gov/15295772/]
[6] Ryrie, A. R. (2019). Postexercise Insulin Sensitivity. Sports Medicine, 49(12), 1839-1849. [https://link.springer.com/article/10.1007/s40279-019-01185-5]
[7] Després, J. P., et al. (1996). Hyperinsulinemia as an Independent Risk Factor for Ischemic Heart Disease. New England Journal of Medicine, 334(15), 952-957. [httpswww.nejm.org/doi/full/10.1056/nejm199604113341504]
[8] World Health Organization. (1999). Diagnostic criteria for diabetes mellitus and other categories of hyperglycaemia. [https://www.who.int/publications-detail-redirect/diagnostic-criteria-for-diabetes-mellitus-and-other-categories-of-hyperglycaemia]
[9] English, E., et al. (2015). Iron Deficiency Anemia and HbA1c: A systematic review and meta-analysis. Clinical Chemistry, 61(11), 1410-1421. [https://academic.oup.com/clinchem/article/61/11/1410/5623000]
[10] Torres-McGehee, T. M., et al. (2012). Stress and the Competitive Athlete. Current Sports Medicine Reports, 11(2), 65-72. [https://journals.lww.com/acsm-csmr/fulltext/2012/03000/stress_and_the_competitive_athlete.12.aspx]
[11] McLaughlin, T., et al. (2003). Use of metabolic markers to identify overweight individuals who are insulin resistant. Annals of Internal Medicine, 139(10), 802-809. [https://pubmed.ncbi.nlm.nih.gov/14623617/]
[12] Gaziano, J. M., et al. (1997). Fasting triglycerides, high-density lipoprotein, and risk of myocardial infarction. Circulation, 96(8), 2520-2525. [https://www.ahajournals.org/doi/10.1161/01.CIR.96.8.2520]